Seeking signals in raw price data is not very productive. The immense sea of numbers generated at every moment means that it is impossible to make sense of everything. So we use charts to create a visual description of price movements for quick interpretation and easy use.
Bar, line and candlestick charts are the most common types of tools used by forex traders.
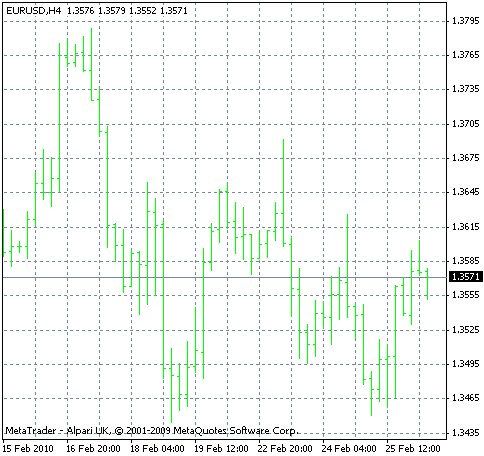
Bar Charts
Bar charts can be useful in both short and long term trading. They provide slightly less information than what we can derive from a candlestick chart, but are sophisticated enough for the creation of any long term or short term strategy.
The upper limit of a bar in a bar chart shows the highest price of the period, while the handle on left-hand side shows the opening price. The lower limit of the bar depicts the lowest low of the period, while the handle on the right side shows the closing price. There are many different formations that result from different configurations of these four pieces of information.
Note: Past performance is not indicative of future results.
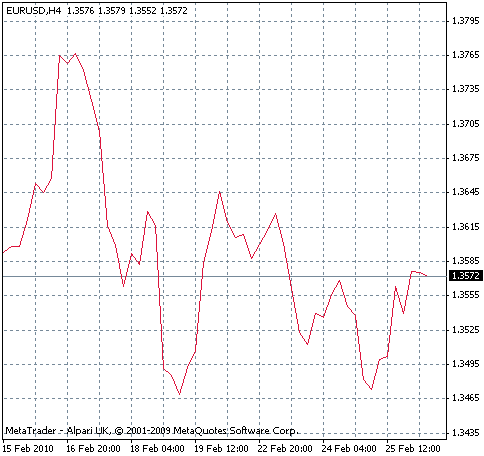
Line Charts
Line charts are the simplest type of charts available to traders. They are most suitable to long term trading, and trend analysis, but have little value for frequent traders due to the insufficient amount of information provided. Line charts can be helpful in isolating trends from a complex portion of the price action. So identified, we can developed the resulting shape for deeper analysis with other, more precise tools
Note: Past performance is not indicative of future results.
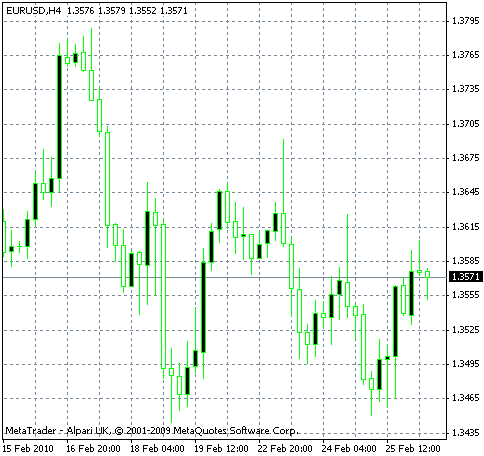
Candlestick Charts
A candlestick charts is another type of chart that is highly popular among traders. It packs a lot of information in a compact form, and is suited to both short and long term trading.
A typical candlestick will be composed of a body, and a line passing through it. Depending on the size and shape of the body and the line, traders are able to determine thrust of the price action, and to generate trade signals.
Note: Past performance is not indicative of future results.
In the above chart, the black candlesticks represent periods where the prices closed lower, and sellers were the winners. White, empty candlestick represents the opposite. The body of the candlestick, as opposed to its wick, shows the open-close range of the market action. The top of the body in a black candlestick is the opening price, and the bottom
Is the close price of the period. In a white candlestick the open price is at the bottom, and the close price is located at the top.
The wick, or the line that goes through the middle of the candlestick body, represents the range between the highest high and lowest low of the day. The upper tip of the wick is the highest high, while the lowest point is the lowest low.
The various formations created by the candle body and the wick are the subject of candlestick analysis, and some traders make use of the chart type exclusively for the derivation of forex signals, with little input from other sources.
Conclusion
The line chart is probably insufficient for medium or short term trading, but both the bar and candlestick charts are highly functional in all types of markets. Your choice about which of the two should be sued will depend for the most part on the visual appeal of the chart type, and the amount of detail you need in formulating forex strategies. Candlesticks pack a big punch with their compact yet rich display of information, and are suitable to both beginning and advanced traders.
Next step: Reading Chart Patterns