Bollinger Bands are a tool for measuring volatility. The indicator is composed of three moving averages, and trade signals are generated by the interaction between the two outer MAs, and also between the price action and the indicator. The two MAs at the top and bottom have the same period and weighting, but they are mirror images of each other, so they create a band and remain around the price regardless of the severity and speed of the fluctuations.
Bollinger Bands are not necessarily devised or used for creating trade signals. Differing levels of volatility will enable different approaches and strategies to the market action, and the Bands are mostly useful for determining this crucial aspect of the price action. Yet common practice among traders is to use them for breakouts from range patterns, and we’ll examine this approach for the sake of completeness.
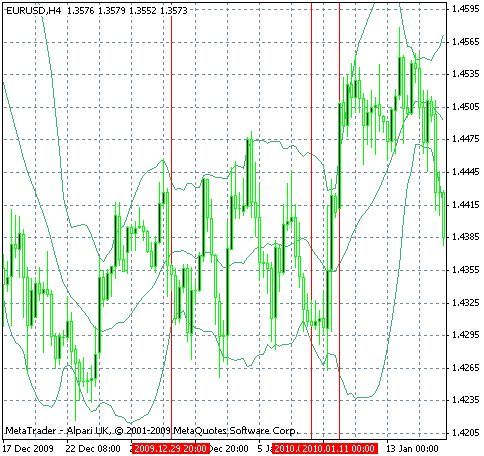
Note: Past performance is not indicative of future results.
Between the first and second vertical lines on the above chart from the left, we note price action contracting to a subdued range pattern, although volatility remains high within the range. In accordance, the Bollinger Bands contract into two small parallel line-like formations that signal the lack of a trend.
Close to the third vertical bar, we note the breakout from the brief range established, and the bands begin to expand strongly and rapidly in both direction. Since volatility tends to accentuate moves in both directions, both the upper and lower bands react strongly to the breakout (and of course both the upper and lower bands are moving averages on the same price action).
We observe also that the false breakout near the third bar that would constitute a trade signal according to the common band crossover technique, but fails the aftermath.
Conclusion
Bollinger Bands are useful for two main purposes, identifying trends, and gauging volatility. Since a strong trend must always be accompanied by rising volatility, the Bands can also be regarded as a supplementary indicator of trend analysis, complementing trend lines. They can be used for identifying lower risk trades on the basis of volatility in accordance with the trader’s strategy. Forex volatility, as measured by the bands, can also be made a part of a fundamental trading strategy.
On the other hand, there really is no basis for the common crossover strategy employed by many traders. In this approach, if the price moves about the upper of the Bands, a bullish breakout is anticipated, and if it falls below the lower band, a bearish formation is expected. This technical method is useful as any other, but it has no predictive or analytical value beyond being a conjecture, and an arbitrary choice for the initiation of a trade.
Next step: Common Chart Indicators